


This dataset’s stories may not surprise you. According to the Seattle Police Department’s official totals for the four East Precinct beats that cover most of Capitol Hill, the first half of 2010 showed a measurable increase in robberies and burglaries in our area. But the blocks of the Hill where crime totals have jumped the most might not be the first place you’d point your finger. Hint: It’s not the downtown side of Broadway where things got ugliest in the first seven months of the year.
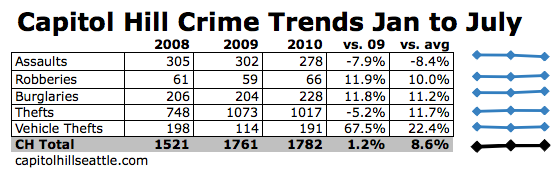 We’ve recently shown you some unofficial measures of what is happening in regards to crime on Capitol Hill in 2010 including this look at our tally of monthly robberies and this comparison of the Hill’s crime levels in relation to the rest of Seattle. With data available through July, here’s a look at the official SPD totals for Capitol Hill.
Overall, thanks to drops in assaults and thefts — the most prevalent crime category in this dataset — 2010’s first seven months net out to a flat comparison to 2009. But those drops mask the near 12% increases for both robberies and burglaries though July. And vehicle thefts really screw up the numbers — that jump looks awful, right? One thing to keep in mind is these totals are highly impacted by enforcement. In 2009, vehicle theft totals dropped after a concentrated effort to lock up some of the area’s most prolific thieves. In 2010, either those guys are back on the street or others with the know-how have moved in and have put things back to “normal.”
As for Capitol Hill’s 2010 crime “problem area” we hinted about up top, here’s a look at the Hill’s four East Precinct beat’s and their recent total crime trends.
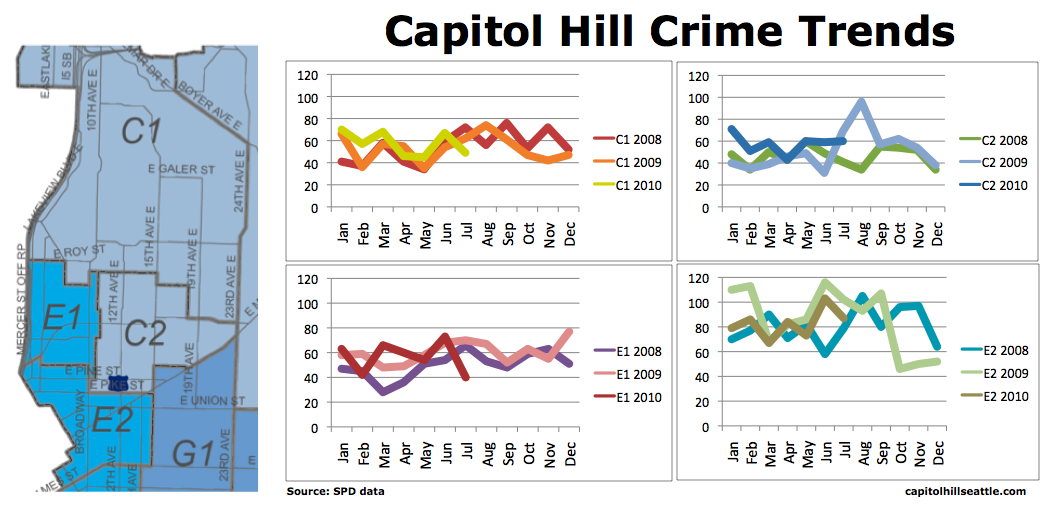
For the most part, the beats aren’t far off recent patterns in their area. One notable change is the odd fall-off in E1 (below Broadway between Mercer and Pine). More details on that in the table below. Another thing that isn’t entirely clear in this view but you can start to see is beat C2’s high line pattern. That’s an area showing above average activity. Like E1, there’s more to see in the actual numbers and category break-outs in the table below.
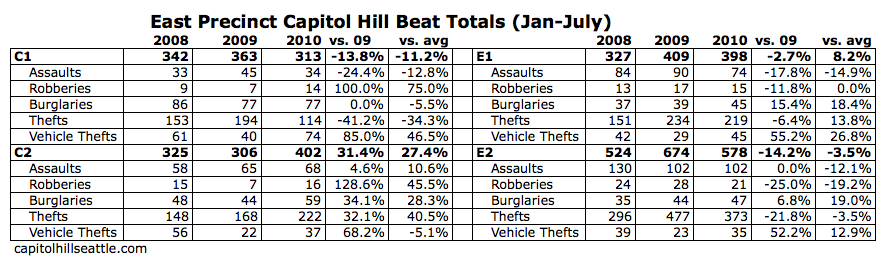
Even though it only covers totals through July, this look at the beat-by-beat totals tells Capitol Hill’s 2010 crime story so far. Crime has dropped in general on the downtown and First Hill edge of Capitol Hill and in the less violent categories like thefts across the entire area, but burglaries and robberies around Broadway, Pike/Pine and north Capitol Hill are way up. On the flipside — below Broadway and the southwestern portion of the hill along with part of First Hill actually saw drops in robberies compared to 2009.
And, yes, statisticians in the CHS audience, we are, indeed, talking about pretty small samples when it comes to measures like 2009’s seven-month tally of robberies in northern Capitol Hill. Take the robberies totals with a grain of salt. The changes may not be statistically significant and could be nothing more than coincidence. But the 34% increase in burglaries in the Hill’s core? You can probably skip the grain of salt on that one.
The beat totals table also illustrates just how widespread the return to 2008 levels of auto theft has been with each of the four areas showing at least a 52% increase.
http://en.wikipedia.org/wiki/How_to_Lie_with_Statistics
Public library: http://tinyurl.com/2ezkfxc
Darrell Huff runs the gamut of every popularly used type of statistic, probes such things as the sample study, the tabulation method, the interview technique, or the way the results are derived from the figures, and points up the countless number of dodges which are used to fool rather than inform.
Not sure if you for em or against em on this one Andrew. Can you summarize for the lazy?