


If you have lived on the Hill since 2000, odds are you have a few more neighbors now than you did eleven years ago. Like the city as a whole, data from the 2010 Census shows growth in population in most census blocks on the Hill. Here’s what else we found.
- The static north (blue): Unlike many other neighborhoods in the city, the Hill north of Republican did not see changes in demographics. The white majority population today is relatively similar to 2000 in most parts of the neighborhood. The Hispanic and Asian populations both grew significantly, though they rarely make up more than 10% in any census block on the Hill (the census block shared by Pike/Pine and First Hill west of Broadway is 12% Asian).
- Hot spot (red) — where we grew the most: The area between Broadway and 15th south of Republican and north of Madison saw the largest increase in population, jumping 13% since 2000. Most of the new residents are white, Hispanic, Asian or multiracial. There was growth along E Olive Way west of Broadway, but areas to the north and south actually saw tiny declines.
 Mark Nowlin / The Seattle Times. With permission. View their map online.
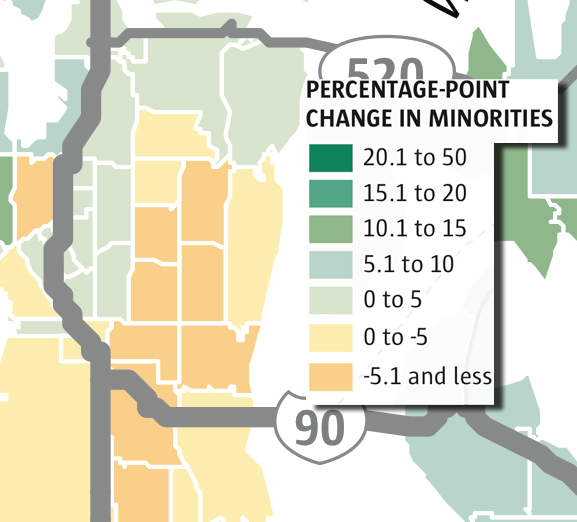
 - Transition zone (yellow) — where we changed the most: The biggest changes occurred along Madison in areas where Capitol Hill historically meets the Central District. While these areas just north of Madison saw some of the biggest growth in population, the black population declined by about a quarter in the same time period.
View 2010 Census Zones in a larger map

This trend matches what has happened in much of the Central District as population growth — often in the double digits — has coincided with declines in the black population. The Central Area, at the heart of the CD, has a white majority now for the first time in over 60 years.
- Elbow room (green) — available housing: One statistic that has changed drastically since 2000 is the number of vacant units on the Hill. Perhaps it was a sign of the times, the housing bubble and that moment of the recession in 2010, but nearly all of the city saw an increase in the number of vacant units compared to 2000.
On the Hill, the area between 15th and I-5 surrounding Volunteer Park has seen an increase in housing units of 7%, but an increase in vacant housing of 242%.
Even in the “hot zone,” the area bounded by Republican, Madison, Broadway and 15th has seen the number of housing units increase by 18% and the number of vacant units has gone up 144%.
- Only the area around Miller Park saw the new housing rate outpace the growth in vacancies.
Data from the 2010 Census is still being released, so there will likely be many more numbers to dive into in the future. Plus, we’re also learning more about how to extract useful insights from the dataset so we can look at information related to LGBT demographics and more information about things like car ownership. To explore these changes (and more) yourself, the New York Times has created an excellent interactive map for the whole country. Seattle Times has also created an interactive map looking at changes in the state and region. We also know the CHS community is a talented bunch. If you’ve dug into the numbers at http://2010.census.gov/2010census/data/ and have something to share about Seattle and Capitol Hill, let us know.![]()
Am I allowed to label I-5 Shores on this map?
By the way, the detailed “Summary File 1” for Washington will be released next week:
http://www.census.gov/newsroom/releases/archives/2010_census
This gets down to block level with data on “cross-tabulations of age, sex, households, families, relationship to householder, characteristics of owners and renters, detailed race and Hispanic or Latino origin groups, and group quarters.”
A great place to look will be the Missouri Census Data Center’s online tool:
http://mcdc.missouri.edu/cgi-bin/uexplore?/pub/data/sf12010
For example, you can click on “alblocks.sas7bdat” (Alabama Census Blocks–obviously use Washington when it’s available), then scroll down to “III. Choose columns (variables)” and choose “Block” on the left an “P12. Sex by Age” on the right and click “Extract Data” and after a few seconds it will take you to a page with a “Delimited File” that you can save and put in Excel. Using that system is a *lot* faster and easier than working with the raw data. Other tools like Social Explorer are easy to use but don’t have all details.
Also a note on “vacant” which basically means anything that’s not a primary residence. Timeshare? Vacant. Corporate-managed relocation or long-term stay apartment? Vacant. 2nd residence? Vacant.
While obviously some of these really are empty some or a lot of the time, it doesn’t really reflect whether or not there are people in them most of the time.
And one thing I’ve looked at:
http://joshuadf.blogspot.com/2011/04/kid-density-as-geek-ini
But in terms of density here’s one tidbit that I kept coming back to:
Location Tract Land Area PopulationUnder 18 Per Acre
Capitol Hill 74.02 249282 2.5
Belltown 80.02 229060 0.9
These two tracts are a couple of the highest density census tracts in Washington State, and are of a similar size. Both are close-in locations with great transit access. Why does Capitol Hill 74.01 have three times the number of kids as Belltown 80.02? To hazard an unscientific guess at the clear preference for Capitol Hill: a wider range of housing types, including family-friendly courtyard apartments; more parks and open space; the presence of nearby public and private schools; safer streets than Belltown’s arterial avenues, some of which carry high-speed one-way traffic; and a wider variety of businesses, including more grocery stores. Of course, if I were properly researching the question I’d probably do some in-depth interviews with a few parents in each area and use that to develop a larger survey of how families choose one or the other.