


Examining the analysis included in the briefing document on the status of the Seattle Transit Master Plan update (see attached PDF), Capitol Hill stands out as a key component of the city’s mass transportation landscape, leading all areas in usage and demand. Here’s a look inside the briefing presented Tuesday to the City Council’s transportation committee as Seattle prepares to update its current 5-year-old plan. We’ve also included a map showing priority spots being considered by the Seattle Department of Transportation for Bridging the Gap levy investments to improve sidewalk and bicycle conditions along Capitol Hill and downtown streets.
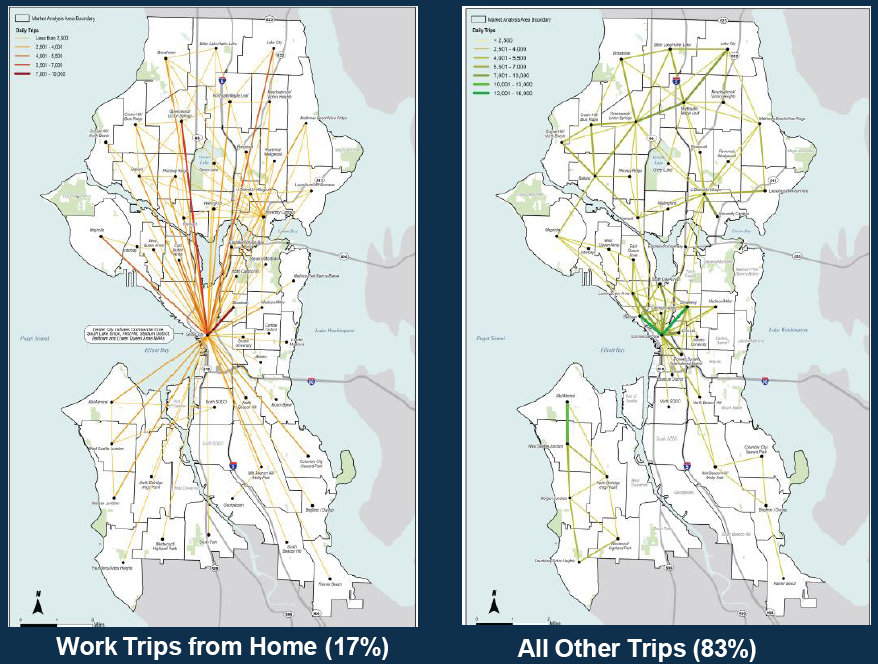
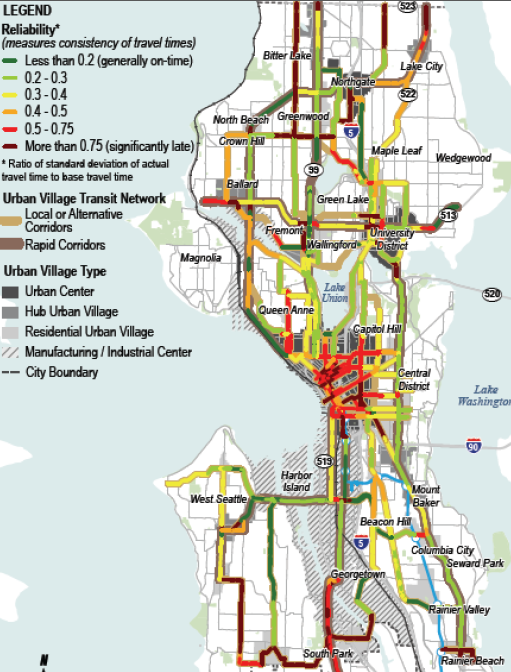
Apologies in advance for some of the hard-to-read graphics. You can check out the attached PDF for (mostly) clearer and larger images. This first map illustrates how many of Seattle’s public transit trips connect to Capitol Hill:
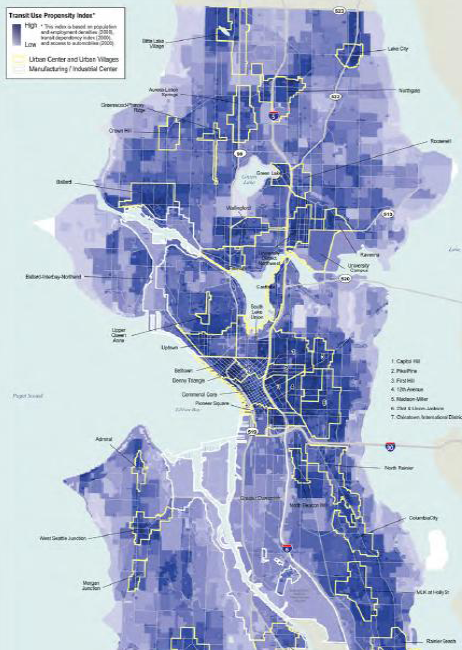
The Hill is also one of the areas in Seattle where citizens are “likely to use” transit — the darker the blue, the higher the score for an area on the Transit Use Propensity Index!
 Here’s a fuzzy zoom on Capitol Hill’s index scores — use blank areas like Volunteer Park to orient yourself and find your non-bus riding neighbors:
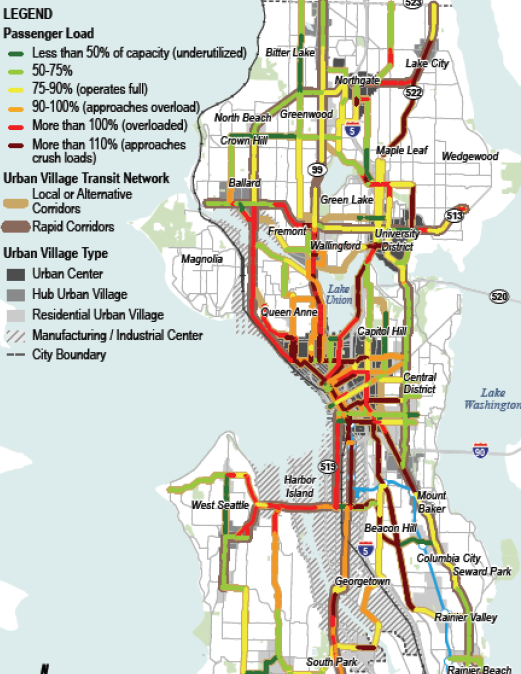
The report also includes some passenger load and reliability data. Raise your hand if you’ve participated in a Downtown > Capitol Hill “crush load.” And if you think bus reliability on your part of Broadway is bad, check out the score south of Madison.
The briefing also has some high level results from a transit survey many of you may have taken in 2010. SDOT collected 9,500 responses — 75% were from transit riders. The highlighted results indicate a a desire for faster service and might tee up a push for a light rail measure on the Seattle ballot.
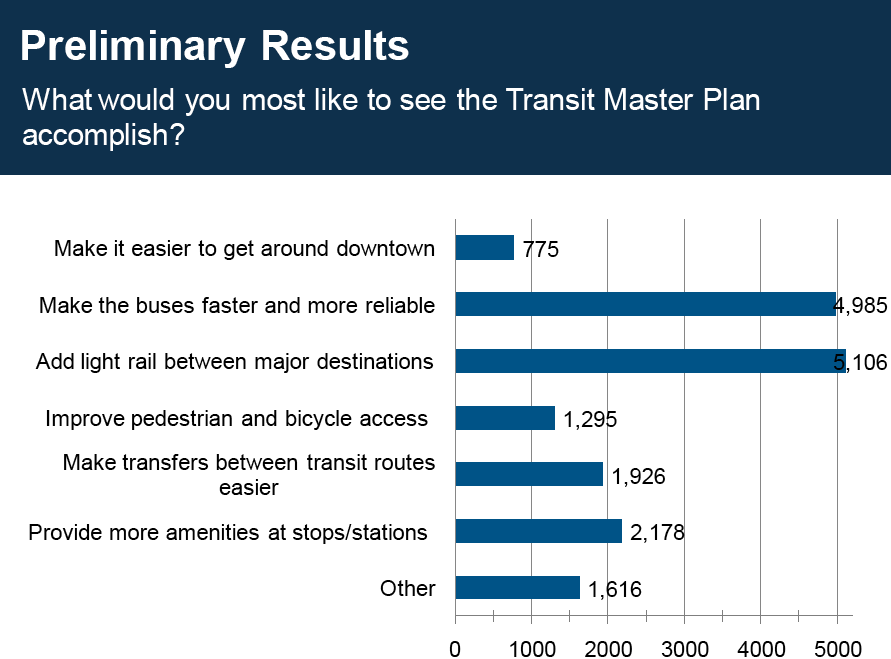
Survey respondents also said 48% of their trips are of 30 minutes or longer.
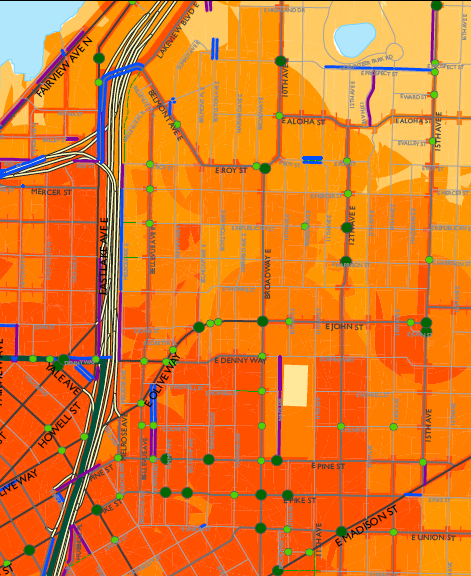
Meanwhile, we also have this map from planning for the 2011 Bridging the Gap levy projects to improve pedestrian and bicycling conditions in the city. The green dots indicate roadway crossings being considered for improvement — large dots indicate areas being considered for the first tier of projects. The purple and blue lines indicate areas being considered along the roadway including areas where sharrows or bike lanes could be added.
Here’s an explanation of SDOT’s bicycle improvements prioritization process:
Potential projects that would expand the system by linking to an existing facility are given greater consideration than potential projects that would be isolated facilities. Similarly, candidate projects that would improve high collision locations are given priority over other routes. SDOT planners look at a number of other factors as well like connections to transit, land use, and socioeconomic and health factors. This information is run through a GIS model and candidate projects are further vetted in the field by staff. After completing the planning process, we move quickly into the design phase. Construction generally occurs during the warmer, dryer summer months.
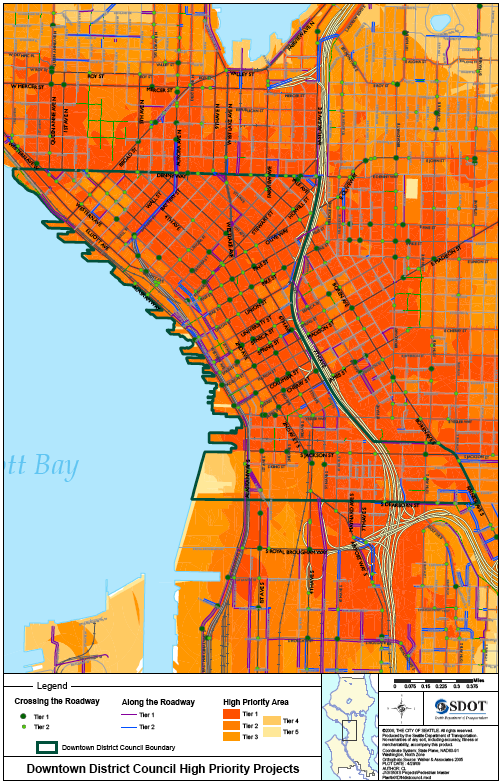
The full downtown area map is below.
Pothole problems?
Meanwhile, SDOT has more immediate concerns as it attempts to ramp up its pothole fighting efforts. You can report street problems here or call 684-ROAD (7623).
We really do live in a colorful neighborhood!
I’d like to know how much Capitol Hill uses Metro’s services as a percentage of total Metro usage in the entire network.
Then, I’d like to know how much Capitol Hill users pay in to Metro (as fares, revenues paid from other means like taxes, etc) in relation to their usage.
I’d be all for areas of the network that don’t use the system as much to pay in a lesser amount than those that use it more (like Capitol Hill.) Other projects like the 520 replacement are being paid for by users. Ideally, Metro users would pay for the entire cost of Metro as the riders are the users of the system and derive the full benefit of it. Those who don’t use Metro shouldn’t have to subsidize the actions of those who do use Metro.
As a side note, Metro is notorious for a huge budget and little meaningful impact on the city. They could easily be far more efficient by doing simple things like cutting pay for their grossly overpaid drivers and eliminating the Ride Free Area downtown.
I’d like to see a model introduced where people who don’t use metro are financially penalized for not doing so thereby offsetting thier inneficiant use of finite resources and lowering the cost for riders and taxpayers both. It could be on the “honor” system.
I think you’re ruling out the fact that many people walk as their sole source of transportation.
It seems you’re quick to jump the gun and make this a cars vs not-cars.
To quote costly – “Other projects like the 520 replacement are being paid for by users..”
This is untrue. Taxes subsidize cars via roads and bridges, as well as transit. The 520 program budget is 4,350 million (not including ongoing operation and maintenance) 520 bridge tolls are expected to make $60 million a year ( http://www.wsdot.wa.gov/Projects/SR520Bridge/financing.htm). So if only 520 bridge users were paying for the bridge.. that would take over 72 years (not including O&M or inflation and interest).
Costly again – “… Metro is notorious for a huge budget and little meaningful impact on the city.”
I disagree. Not about your claim as to the budget, but you statement that our Metro buses have little meaningful impact on the city. As the study analyzed in the above articles shows, many people find the bus an integral part of their lives. Namely, many people in Capitol Hill. I have used the bus as my primary means of transportation for over 3 years both to travel to my engineer job and to take to other neighborhoods for nights out on the town. As for the City as a whole, per the 2009 Census, Seattle leads the Pacific Northwest for transit commuting with 19.8% of workers commute to Seattle by bus or train. Portland follows us with 11.5% of people commuting to work by transit. Seattle also leads the pacific northwest for commuting by combined alternate transportation options (47.1% people commute by bike/carpool/bus/walk/work from home or 52.9% people drove alone to work.. the lowest in the pacific northwest. Portland follows us with 61.6% people driving to work alone). (Note those stats include Sound Transit commuters also)
I would say that transit has a pretty meaningful contribution to the city. The above statistics are just for commuters. There are more people who use transit to get downtown for shopping etc.
See data here:
http://daily.sightline.org/daily_score/archive/2010/10/07/ho
http://daily.sightline.org/daily_score/archive/2010/10/04/wh
Costly, it’s sad to see your anti-community stance and me-versus-them stand. Have you ever been to Canadian cities and Europe, where it’s common to pool resources to create and operate public transport that offers options, helps keep water and air quality from deteriorating faster, prevents worse congestion and serves all users who want it.
It’s so typically United Statesian to argue a selfish me, me, me argument instead of acknowledging that society (we, us, including you) benefits when those in society have options based on common sense. Amongst vehicular options, cycling and public transport are worthy, justifiable investments for the general public. It’s very, very, very well document that our overused road infrastructure -whomever pays to build it- harms everyone in many ways.
kudos if YOU walk. Please don’t wish your way on everyone just because you think we shouldn’t all pay progressively to build and maintain logical infrastructure that benefits all of us more than it harms, regardless of who uses it.
I just wanted to point out that the 17/83% numbers (and accompanying maps) refer to trips by all modes in Seattle, not just transit trips. In reality, far more than 17% of public transit trips are commutes, largely because Metro has an inordinately high amount of peak service vs. off-peak.
Your assumption that people who drive cover all the costs of what they use is laughable at best. Good transit/walking/biking facilities means less money needed to build bigger roads. And Seattle’s roads are paid for almost entirely by property tax, so even people who don’t drive and instead take the bus, bike, and or walk are paying into the road system.